Your team has successfully deployed a UCP-compliant commerce agent with solid security, reliable inventory synchronization, and proper state management. But post-deployment metrics reveal a critical issue: conversion rates are 40-50% below projections, and session abandonment spikes whenever agent response times exceed 2 seconds.
This isn’t a business problem—it’s an architectural one. Unlike traditional e-commerce where 100ms delays incrementally impact conversion, agentic commerce operates under real-time interaction constraints. Users expect conversational fluency comparable to human chat agents, creating a hard ceiling on acceptable latency.
The Technical Context: Why Agentic Commerce Has Different Performance Requirements
Traditional e-commerce architecture optimizes for page load times and API response rates measured in hundreds of milliseconds. Agentic commerce introduces a fundamentally different performance model where the system must maintain conversational flow across multi-turn interactions, each potentially triggering cascaded API calls to LLM providers, inventory systems, and payment processors.
The key architectural challenge: latency compounds across conversation turns. A 1.5-second response time per turn becomes 4.5 seconds for a three-turn transaction flow—well beyond the abandonment threshold for most users.
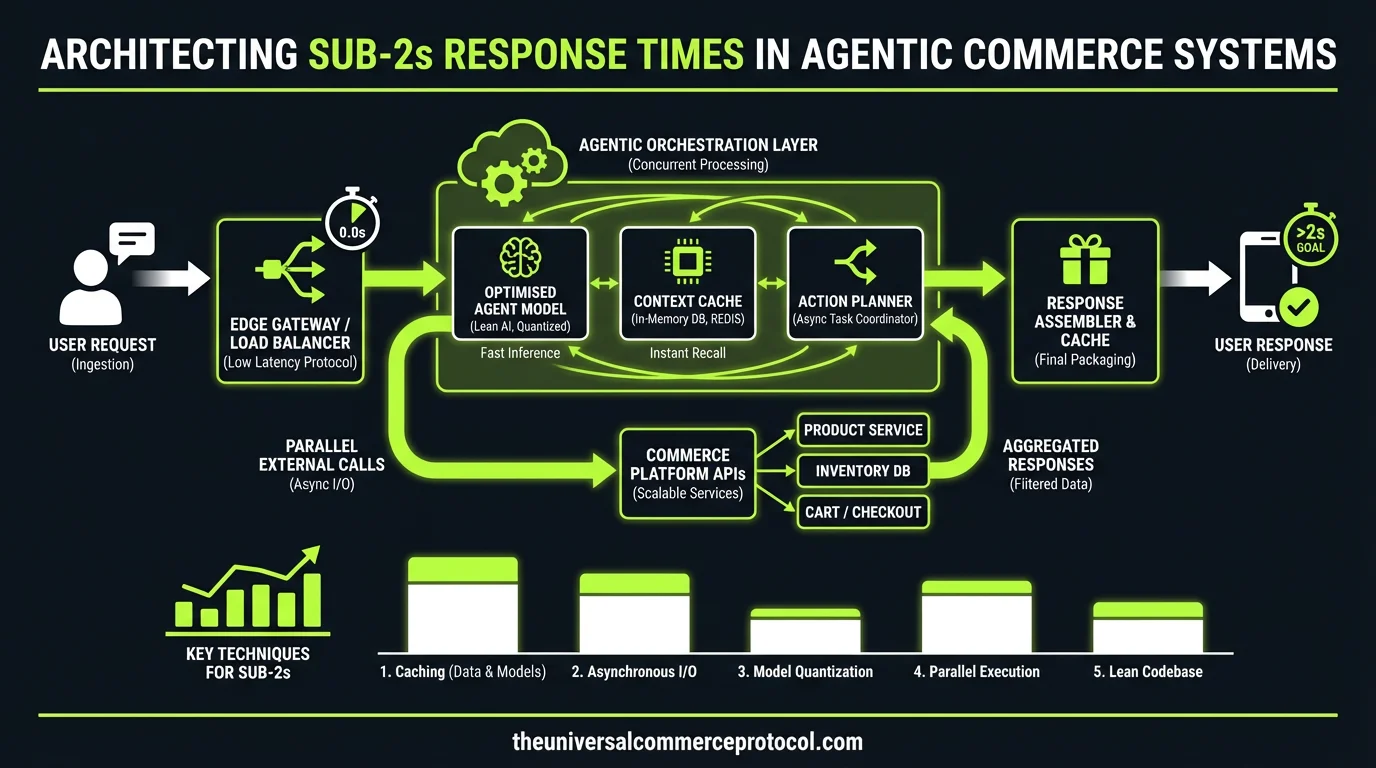
Architecture Overview: Identifying Latency Sources in the Request Path
LLM Inference Bottlenecks
The primary latency source in most implementations is LLM inference time. Production deployments typically see 500ms to 3+ seconds per inference call, depending on model selection and prompt complexity. For GPT-4 or Claude-3, expect 800ms-2s for medium-complexity prompts. Smaller models like GPT-3.5-turbo typically deliver 300-800ms response times.
Architectural decision: Implement a model routing layer that directs queries to appropriately-sized models based on complexity scoring. Simple product queries can route to fine-tuned smaller models, while complex transaction logic uses full-scale models.
Data Layer Performance Bottlenecks
Real-time inventory lookups add 100-500ms per query, depending on your data architecture. If you’re hitting your primary OLTP database for every stock check, you’re likely seeing 200-400ms per query under load.
Payment authorization through third-party processors (Stripe, Adyen, etc.) typically requires 500ms-2s for authorization, with additional latency if fraud detection rules trigger extended verification flows.
State Management Overhead
Conversation state persistence adds 50-200ms per turn if you’re serializing/deserializing full context to your database. This compounds quickly in multi-turn conversations.
Integration Architecture: Implementing Low-Latency Patterns
Parallel Processing and Request Batching
Instead of sequential API calls, implement parallel request patterns where possible. When a user asks about product availability, simultaneously query inventory, pricing, and shipping options rather than chaining requests.
Example implementation:
// Instead of sequential calls
inventory → pricing → shipping → LLM inference

// Implement parallel pattern
Promise.all([
  inventoryService.checkStock(sku),
  pricingService.getPrice(sku, userId),
  shippingService.calculateOptions(sku, zipCode)
]).then(results => llmService.generate(prompt, results))
Caching Strategy Implementation
Implement a multi-tier caching strategy:
- L1 Cache (In-memory): Product metadata and high-velocity inventory counts with 10-30 second TTLs
- L2 Cache (Redis): User session state and conversation context
- L3 Cache (CDN): Static product information and catalog data
For inventory specifically, consider implementing an event-driven cache invalidation pattern using pub/sub to maintain accuracy while minimizing database hits.
LLM Response Optimization
Implement speculative decoding for high-traffic scenarios. Generate multiple response branches in parallel and surface the fastest complete response. This requires additional compute overhead but can reduce perceived latency by 20-30%.
Consider implementing request warming for logged-in users—pre-generate likely responses based on browsing context and cache them with short TTLs.
Operational Considerations: Monitoring and Failure Handling
Latency Monitoring Implementation
Implement distributed tracing across your agent request path. Track timing for:
- LLM inference time (by model and prompt type)
- Database query time (by operation type)
- Third-party API response time (by provider)
- Network hop timing
- State serialization/deserialization overhead
Set up alerting for 95th percentile response times exceeding 1.5s, giving you margin before user abandonment thresholds.
Graceful Degradation Patterns
Implement circuit breaker patterns for external dependencies. When payment authorization exceeds 2s, switch to optimistic order confirmation with background reconciliation. When inventory lookups timeout, fall back to cached availability with appropriate disclaimers.
For LLM inference failures or timeouts, maintain pre-generated fallback responses for common queries that can be served in <100ms.
Team and Tooling Requirements
Successfully implementing sub-2s agent response times requires specific technical capabilities on your team:
Required expertise:
- Distributed systems performance tuning
- Database optimization and caching strategies
- LLM inference optimization and model selection
- Real-time monitoring and observability implementation
Tooling considerations:
- APM tools with distributed tracing (Datadog, New Relic, or Jaeger)
- Load testing tools capable of simulating conversational flows
- Database performance monitoring
- LLM provider API performance monitoring
Recommended Implementation Approach
Start with measurement. Implement comprehensive timing instrumentation across your current agent request path to identify your primary latency sources. Most teams discover that 60-70% of their latency comes from one or two sources.
Phase 1: Implement caching for your highest-impact bottleneck (typically inventory or LLM inference)
Phase 2: Add parallel processing patterns for multi-API requests
Phase 3: Optimize state management and implement connection pooling
Phase 4: Implement advanced patterns like speculative decoding and request warming
Target architecture should deliver 90% of agent responses in <1.5s, with 99% <2.5s.
Next Technical Steps
Implement distributed tracing across your agent infrastructure this week. Identify your top three latency sources and assign engineering resources to address them in order of impact. Set up automated performance regression testing to prevent latency creep in future deployments.
Consider evaluating regional deployment strategies if you’re serving geographically distributed users—network latency to LLM providers can add 200-500ms depending on geographic distance.
FAQ
Should we build our own LLM inference infrastructure to reduce latency?
Only if you have significant scale (10M+ requests/month) and dedicated ML infrastructure expertise. For most teams, optimizing model selection and implementing request batching with major providers delivers better ROI than building inference infrastructure.
How do we handle latency when integrating with legacy ERP systems?
Implement an integration layer with aggressive caching and async processing. Pre-load critical data (inventory, pricing) into fast storage and use eventual consistency patterns. For non-critical ERP data, implement background sync with cached fallbacks.
What’s the recommended approach for handling payment processor latency?
Implement optimistic order confirmation for low-risk transactions. Confirm the order immediately and reconcile payment authorization in the background. Use risk scoring to determine when to wait for synchronous authorization versus optimistic processing.
How do we test agent latency performance at scale?
Build conversation flow load tests that simulate realistic multi-turn interactions, not just single API calls. Use tools like Artillery or k6 with custom scripts that maintain conversation state across requests. Test with realistic data volumes in your inventory and user databases.
What metrics should we track for ongoing latency optimization?
Track P95 response time by conversation turn, abandon rate correlation with response time, and component-level timing (LLM, database, third-party APIs). Set up synthetic transaction monitoring to catch latency regressions before they impact users.
This article is a perspective piece adapted for CTO audiences. Read the original coverage here.
Frequently Asked Questions
Q: Why do agentic commerce systems have stricter latency requirements than traditional e-commerce?
A: Agentic commerce operates under real-time interaction constraints where users expect conversational fluency comparable to human chat agents. Unlike traditional e-commerce where 100ms delays have incremental impacts, agentic systems face a hard ceiling on acceptable latency. Users abandon sessions when response times exceed 2 seconds because latency compounds across conversation turns—a 1.5-second response per turn becomes 4.5 seconds for a three-turn transaction, well beyond abandonment thresholds.
Q: How does latency compound in multi-turn agentic commerce interactions?
A: Each conversation turn can trigger cascaded API calls to LLM providers, inventory systems, and payment processors. When individual response times are 1.5 seconds, a three-turn transaction flow reaches 4.5 seconds of cumulative latency. This architectural pattern makes it critical to optimize not just individual components, but the entire request path to maintain sub-2s response times per turn.
Q: What are the primary latency sources in agentic commerce request paths?
A: The main bottlenecks include LLM inference time, which represents a significant portion of response latency as the system generates conversational responses and processes complex queries. Additional latency sources include inventory system synchronization, payment processor integration, and state management across multi-turn interactions.
Q: How much do conversion rates drop when agentic commerce response times exceed 2 seconds?
A: Post-deployment metrics show conversion rates can drop 40-50% below projections when response times consistently exceed 2 seconds, with session abandonment spiking dramatically during slower interactions. This demonstrates that sub-2s response time is not just a performance goal but a critical business requirement.
Q: What architectural components are essential for maintaining sub-2s response times in agentic commerce?
A: Beyond individual component optimization, a complete architecture requires UCP-compliance for security, reliable inventory synchronization to avoid cascading delays, and proper state management to prevent redundant processing across conversation turns. These elements work together to minimize latency throughout the entire interaction flow.
Leave a Reply