Your engineering team just deployed a multi-agent commerce system processing $2M daily transactions. Three agents handle discovery, pricing, and fulfillment coordination through asynchronous message passing. At 2 AM, transaction success rates drop 15%. Your existing APM stack shows healthy API response times, but you have zero visibility into agent decision trees, state propagation failures, or cascade effects between reasoning systems.
This is the core architectural challenge in agentic commerce: traditional observability patterns fail when deterministic request-response flows give way to non-deterministic, multi-hop agent interactions.
The Technical Architecture Gap
Standard e-commerce observability assumes predictable execution paths. User clicks product → cart service called → payment processor invoked → order confirmed. Linear, traceable, debuggable.
Agent systems introduce probabilistic decision branches:
- Intent disambiguation: Same customer query triggers different agent tool selections based on model state
- Multi-agent consensus: Pricing agent and inventory agent negotiate final order terms through multiple round trips
- Dynamic fallback chains: Primary reasoning path fails, agent switches to heuristic-based backup logic
- Stateful context propagation: Agent decisions depend on accumulated conversation context, not just current request
Your distributed tracing sees the API calls. It doesn’t see the why behind agent tool selection, confidence thresholds that trigger escalations, or state mutations that cause downstream decision drift.
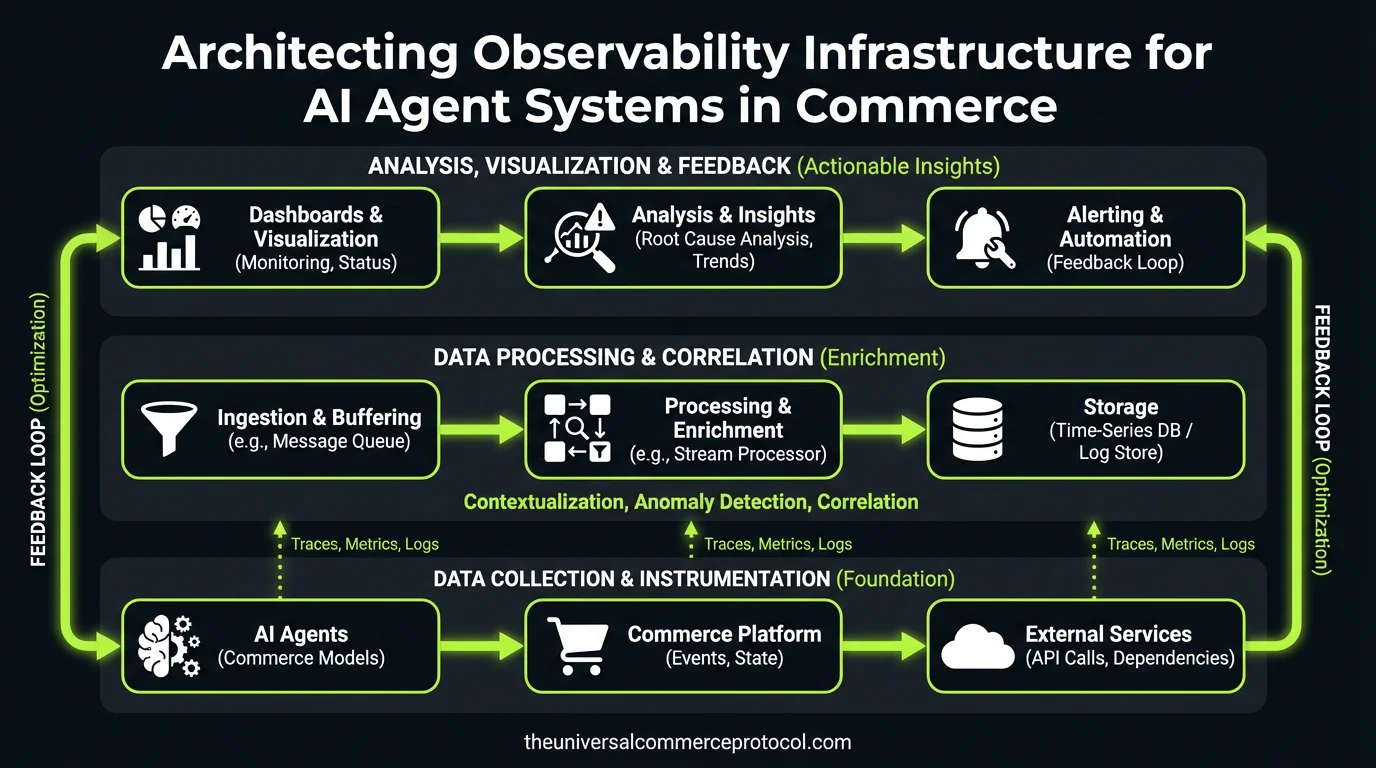
Multi-Layer Observability Architecture
Layer 1: Atomic Agent Instrumentation
Every agent action must emit structured telemetry before execution. This requires instrumenting at the reasoning level, not just the API boundary.
Required trace data schema:
{
  "timestamp": "2024-03-14T09:22:15.123Z",
  "agent_id": "pricing-agent-v2.1",
  "model_version": "gpt-4-1106-preview",
  "session_context_hash": "sha256:a1b2c3...",
  "input_tokens": 847,
  "intent_classification": {
    "primary": "bulk_discount_calculation",
    "confidence": 0.87,
    "alternatives": ["standard_pricing", "enterprise_quote"]
  },
  "tool_invocations": [
    {
      "tool": "inventory_service",
      "method": "check_bulk_availability",
      "params": {"sku": "PRD-8847", "quantity": 500},
      "latency_ms": 145,
      "cache_hit": false
    }
  ],
  "reasoning_checkpoints": [
    "inventory_sufficient_for_bulk",
    "customer_qualifies_for_tier2_discount",
    "applying_15_percent_reduction"
  ],
  "output_confidence": 0.93,
  "escalation_triggered": false
}
Implementation approach: Instrument at the LLM framework level (LangChain, AutoGPT) rather than application code. This ensures trace consistency across agent types and reduces instrumentation maintenance overhead.
Layer 2: Cross-Agent Transaction Correlation
Commerce transactions span multiple agents with async handoffs. A single customer order might involve:
- Discovery agent (product search)
- Negotiation agent (pricing, discounts)
- Validation agent (fraud detection, compliance)
- Fulfillment agent (shipping coordination)
Each agent makes independent decisions that create downstream constraints. You need causal tracing across agent boundaries.
Correlation strategy:
- Transaction context propagation: Inject correlation IDs into agent prompt context, not just HTTP headers
- State snapshot storage: Persist agent decision state at each handoff point for failure analysis
- Dependency graph construction: Build real-time maps of agent interaction patterns to identify bottlenecks
Data flow architecture: Implement event sourcing for agent decisions. Each agent publishes decision events to a central event store, enabling temporal reconstruction of transaction state at any point.
Integration Patterns and Implementation Path
Option 1: Extend Existing APM (Datadog, New Relic)
Pros: Leverage existing alerting infrastructure, unified dashboard
Cons: Custom metrics for agent reasoning, limited support for non-HTTP interactions
Implementation: Use APM’s custom events API to push agent telemetry, build agent-specific dashboards on top
Option 2: Dedicated Agent Observability Platform
Pros: Native support for LLM traces, built-in agent debugging tools
Cons: Additional vendor relationship, integration complexity with existing monitoring
Evaluation criteria: Multi-agent transaction correlation, real-time alerting on confidence score drops, cost per million agent interactions
Option 3: Build Internal Telemetry Infrastructure
Pros: Complete control over data schema, custom analytics
Cons: Significant engineering investment, operational overhead
Technical stack: OpenTelemetry for instrumentation, Kafka for event streaming, ClickHouse for analytics storage, Grafana for visualization
Operational Considerations
Performance Impact
Agent observability adds 15-30ms per transaction in telemetry overhead. For high-frequency trading or real-time inventory systems, implement:
- Async telemetry pipelines: Never block agent execution on trace logging
- Sampling strategies: Full traces for errors/escalations, sampled traces for successful operations
- Batch transmission: Buffer trace data locally, transmit in batches to reduce network overhead
Data Volume Management
Production agent systems generate 10-100x more telemetry than traditional applications. A single agent decision produces 2-5KB of structured trace data.
Storage strategy:
- Hot storage (7 days): Full trace data for active debugging
- Warm storage (90 days): Aggregated metrics, sampled traces
- Cold storage (2 years): Compliance audit trails, compressed format
Privacy and Compliance
Agent traces contain customer PII embedded in reasoning context. Implement field-level encryption for sensitive data, automated PII redaction in trace pipelines, and configurable retention policies per data classification.
Team and Tooling Requirements
Skills gap assessment: Traditional SRE teams understand distributed systems debugging but lack experience with LLM failure modes (hallucinations, context window limits, prompt injection).
Training requirements:
- Agent reasoning pattern analysis
- Confidence score interpretation and alerting
- Multi-agent transaction debugging techniques
Tooling integration: Extend existing runbooks with agent-specific debugging procedures. “Transaction failure” runbooks must now include agent decision tree analysis, not just API error investigation.
Recommended Implementation Approach
Phase 1 (Weeks 1-4): Implement basic agent instrumentation using OpenTelemetry, focus on critical transaction paths
Phase 2 (Weeks 5-8): Add cross-agent correlation, build initial alerting on confidence score thresholds
Phase 3 (Weeks 9-12): Develop agent-specific dashboards, integrate with existing incident response workflows
Success metrics: Mean time to resolution (MTTR) for agent-related incidents, percentage of agent decisions with full trace coverage, false positive rate on agent confidence alerting
Next Technical Steps
- Architecture review: Audit current agent deployment patterns, identify instrumentation insertion points
- Proof of concept: Implement observability for one agent type, measure performance impact
- Vendor evaluation: If building vs. buying, establish RFP criteria focused on agent-specific features
- Team readiness: Plan SRE training program, update incident response procedures
FAQ
How do we handle observability for agents running on different LLM providers (OpenAI, Anthropic, local models)?
Implement observability at the agent framework level, not the LLM API level. Use OpenTelemetry’s semantic conventions to create provider-agnostic trace schemas. This ensures consistent telemetry regardless of underlying model infrastructure.
What’s the recommended approach for correlating agent decisions with business outcomes in A/B testing scenarios?
Extend your existing experimentation platform to include agent version as a treatment dimension. Instrument agent traces with experiment IDs, enabling correlation between agent reasoning patterns and conversion metrics. Store experiment context in agent trace metadata for post-hoc analysis.
How do we implement real-time alerting on agent reasoning quality degradation?
Monitor confidence score distributions over time windows. Alert when average confidence drops below historical baselines or when high-confidence decisions start producing business metric degradation. Implement circuit breakers that disable agents when confidence scores drop below critical thresholds.
What are the security implications of logging detailed agent reasoning traces?
Agent traces contain business logic details that could be valuable to competitors. Implement role-based access controls for trace data, encrypt traces at rest, and consider on-premises deployment for sensitive reasoning patterns. Never log raw customer PII in trace reasoning steps.
How do we measure ROI on agent observability infrastructure investment?
Track reduction in MTTR for agent-related incidents, percentage reduction in false escalations, and prevention of high-value transaction failures through proactive monitoring. Calculate cost of observability infrastructure against prevented revenue loss from undetected agent failures.
This article is a perspective piece adapted for CTO audiences. Read the original coverage here.
Leave a Reply