Introduction
Modern data stacks are complex. Organizations run multiple data sources, multiple transformation pipelines, multiple BI tools, and increasingly multiple AI applications — all at the same time. The result is metric fragmentation, inconsistent business logic, and a complete breakdown of trust in data.
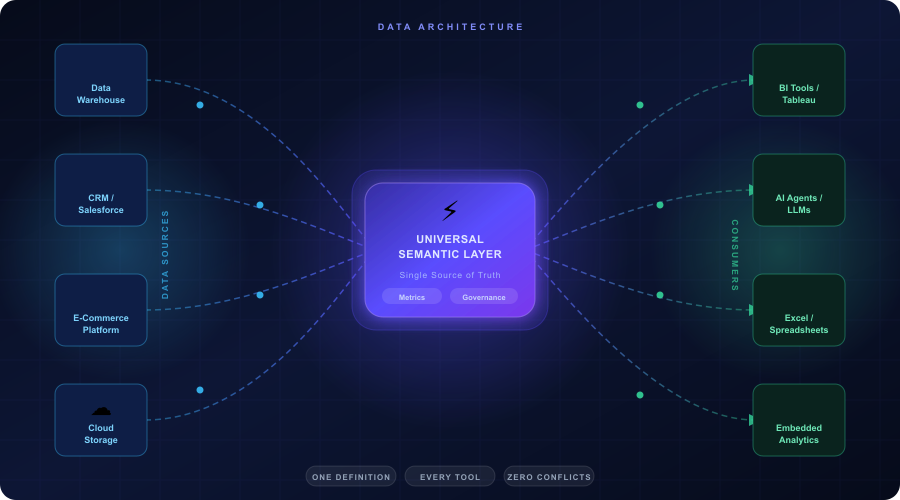
The Universal Semantic Layer (USL) is the architectural solution to this problem. It is a headless, tool-agnostic abstraction layer that sits between your data storage and your data consumers, exposing governed metrics and business logic through APIs that any downstream tool can consume.
This post covers what a USL is, how it works under the hood, its core components, how it fits into the modern data stack, and how to implement one.
What Is a Universal Semantic Layer — Technically
A Universal Semantic Layer is a centralized metadata and business logic layer that:
- Sits between your data warehouse or lakehouse and all downstream consumers
- Defines metrics, dimensions, hierarchies, and relationships once in a declarative semantic model
- Exposes those definitions through APIs — REST, GraphQL, JDBC, or MDEX — so any tool can query governed data
- Applies business logic, joins, aggregations, and filters at query time without duplicating or moving data
- Enforces row-level security and role-based access control centrally
The key architectural distinction is that a USL is headless — it has no front-end UI of its own. It is purely a logic and API layer. BI tools, AI agents, notebooks, and embedded applications all connect to it as a data source and consume pre-defined, trusted metrics.
This is fundamentally different from a tool-embedded semantic layer like Tableau’s Data Source or Power BI’s Dataset, which are local to that tool and cannot be shared across the stack.
The Problem It Solves — Metric Fragmentation
In a typical modern data stack without a USL, business logic is duplicated across every tool independently.
A metric like Monthly Recurring Revenue might be defined as a DAX formula in Power BI, a calculated field in Tableau, a SQL query in a Jupyter notebook, a dbt metric in the transformation layer, and a custom formula in Excel.
Each definition drifts slightly over time. Different engineers write slightly different filters. Different tools handle NULL values differently. Time zones get applied inconsistently. The result is that the same metric returns different values depending on which tool you query it from.
This is called metric fragmentation, and it is one of the most expensive problems in enterprise data management. Harvard Business Review estimates that poor data quality costs organizations an average of $12.9 million per year.
A USL eliminates metric fragmentation by making the semantic layer the single authoritative source for all metric definitions. Business logic is written once, versioned, tested, and served consistently to every downstream consumer.
Core Technical Components
1. Semantic Model
The semantic model is the heart of the USL. It is a declarative configuration — written in YAML, JSON, or a domain-specific language — that defines:
- Entities: the core business objects like Customer, Product, Order, and Employee
- Measures: numeric aggregations like Revenue, Order Count, and Average Order Value
- Dimensions: attributes used for slicing and filtering like Region, Category, and Date
- Relationships: how entities join together, including join type, cardinality, and join keys
- Hierarchies: drill-down paths like Year → Quarter → Month → Day or Country → Region → City
Example of a semantic model definition in dbt Semantic Layer YAML format:
semantic_model:
name: orders
model: ref(‘fct_orders’)
entities:
– name: order_id
type: primary
– name: customer_id
type: foreign
measures:
– name: revenue
agg: sum
expr: net_amount
– name: order_count
agg: count_distinct
expr: order_id
dimensions:
– name: order_date
type: time
type_params:
time_granularity: day
– name: region
type: categorical
This single definition is then available to every tool connected to the USL. No tool ever needs to write its own revenue calculation again.
2. Metrics Layer
The metrics layer sits on top of the semantic model and defines higher-level KPIs that combine measures, filters, and time windows. Examples include:
- Monthly Active Users: count distinct users who performed an event in the last 30 days
- Customer Churn Rate: customers lost in a period divided by customers at the start of that period
- Net Revenue Retention: expansion revenue minus churn revenue divided by prior period revenue
These metrics often involve complex logic — window functions, period-over-period comparisons, cohort filters — that would be error-prone if duplicated across tools. In the USL, they are defined once with full test coverage.
3. Query Engine and SQL Generation
When a BI tool or API client requests a metric, the USL does not return raw data. It:
- Receives the request — for example, “give me Revenue by Region for Q1 2026”
- Resolves the metric definition from the semantic model
- Determines the correct joins between tables based on the defined relationships
- Generates optimised SQL and pushes it down to the data warehouse
- Applies any row-level security filters based on the requesting user’s role
- Returns the result set to the calling tool
This pattern is called pushdown query execution. The computation happens inside your data warehouse where it is most efficient. The USL acts as an intelligent query router and SQL generator, not a data processing engine itself.
4. Caching and Performance Layer
Enterprise USL platforms typically include a caching layer that stores pre-computed query results for common metric requests. This reduces load on the warehouse and dramatically improves query response times for dashboards and reports.
More advanced platforms support pre-aggregation — where the USL pre-computes roll-ups of high-cardinality data at scheduled intervals and stores them in materialized tables. When a query comes in, the USL routes it to the pre-aggregated table instead of scanning billions of raw rows.
5. Access Control and Governance Layer
The USL enforces data access centrally through:
- Role-Based Access Control (RBAC): different user roles see different metrics and dimensions
- Row-Level Security (RLS): a regional sales manager only sees data for their region, even if they use the same dashboard as a national manager
- Column-Level Security: sensitive fields like salary or PII can be masked or hidden for certain roles
- Audit Logging: every query is logged with the user identity, timestamp, and metric requested — critical for compliance with GDPR, HIPAA, and SOC 2
Because all access control is defined in one place, adding a new BI tool or AI agent to the stack automatically inherits all existing security rules. There is no need to reconfigure permissions tool by tool.
6. API Layer
The USL exposes its semantic model and metric results through multiple API protocols to support different consumers:
- REST API: for web applications and embedded analytics
- GraphQL API: for flexible, client-driven queries
- JDBC/ODBC drivers: for compatibility with SQL-based BI tools like Tableau and Power BI
- MDX protocol: for Excel and OLAP-style pivot table queries
- MCP (Model Context Protocol): an emerging standard for connecting AI agents and LLMs to governed data sources
This multi-protocol API layer is what makes the USL truly universal — it speaks the native language of every tool in your stack.
How It Fits Into the Modern Data Stack
The modern data stack typically has five layers:
Layer 1 — Ingestion
Raw data is pulled from source systems — SaaS applications, databases, event streams — using tools like Fivetran, Airbyte, or Kafka and loaded into a data warehouse or lakehouse.
Layer 2 — Storage
Data is stored in a cloud data warehouse like Snowflake, Google BigQuery, Amazon Redshift, or Databricks. Raw tables sit in a landing schema, organized by source system.
Layer 3 — Transformation
Tools like dbt transform raw tables into clean, modelled fact and dimension tables following dimensional modelling principles — star schema or snowflake schema. This is where data cleaning, deduplication, and business logic baked into the data model happens.
Layer 4 — Semantic Layer (The USL lives here)
The USL sits on top of the transformed tables and adds the business meaning layer — metric definitions, KPIs, hierarchies, relationships, and access control. This is the layer that makes data consumable for every downstream tool without further transformation.
Layer 5 — Consumption
BI tools, AI agents, notebooks, embedded apps, and APIs all connect to the USL and consume governed, pre-defined metrics. They never touch raw tables directly.
Without a USL, Layer 5 tools connect directly to Layer 3 or even Layer 2, writing their own business logic in isolation. The USL closes that gap.
Universal Semantic Layer vs Tool-Embedded Semantic Layer
Scope
A tool-embedded semantic layer works only within that tool. A USL works across every tool simultaneously.
Business logic location
In a tool-embedded layer, business logic lives inside the tool’s proprietary format — LookML for Looker, DAX for Power BI, calculated fields for Tableau. In a USL, business logic lives in a vendor-neutral, version-controlled semantic model.
Consistency
A tool-embedded layer guarantees consistency only within that tool. A USL guarantees consistency across all tools.
Maintenance
With tool-embedded layers, when a metric definition changes, you update it in every tool separately. With a USL, you update it once and it propagates everywhere automatically.
AI compatibility
Tool-embedded layers were not designed for AI consumption. A USL exposes metrics through APIs and MCP that AI agents and LLMs can query directly with governed, accurate business logic.
Portability
Tool-embedded layers create vendor lock-in. Switching from Tableau to Power BI means rebuilding your semantic model. A USL is independent of any vendor, so switching tools is just a matter of pointing the new tool at the same USL.
Popular Universal Semantic Layer Platforms
Cube
Open-source headless BI platform written in Node.js. Defines semantic models in YAML or JavaScript. Exposes REST, GraphQL, and SQL APIs. Supports pre-aggregations and caching. Widely used for embedded analytics use cases.
dbt Semantic Layer
Built into the dbt ecosystem. Defines metrics in YAML alongside your dbt models. Tight integration with the transformation layer means metrics are defined close to where the data is modelled. Supported by partner integrations with Tableau, Mode, Hex, and others.
AtScale
Enterprise-grade USL that sits on top of cloud data warehouses. Strong support for MDX and Excel-based OLAP queries. Has been adding MCP support for AI agent connectivity. Focuses on large enterprise deployments with complex security requirements.
Denodo
A data virtualisation platform with a strong semantic layer component. Can connect to a wider variety of data sources than pure warehouse-focused tools, including APIs, legacy databases, and real-time streams.
Databricks Unity Catalog with Business Semantics
An embedded-in-platform approach where semantic definitions are co-located with the data in Databricks. Tight integration with governance, lineage, and compute infrastructure.
Looker with LookML
While Looker is a BI tool, its LookML semantic layer is powerful enough to serve as a partial USL when used as a headless data API. Many organizations use Looker’s API to serve governed metrics to other tools.
Implementation Architecture — Step by Step
Step 1 — Audit existing metric definitions
Catalogue every metric definition across every tool. Document where they agree and where they diverge. This gives you the scope of the problem and a prioritised list of metrics to standardise.
Step 2 — Design your semantic model
Working with data engineers and business stakeholders together, design the entity-relationship structure of your semantic model. Define your core entities, their primary and foreign keys, and the relationships between them. This is your data contract.
Step 3 — Define your metrics and dimensions
Write metric definitions for every KPI — including the aggregation type, the base measure, any filters, and the applicable dimensions. Add time grain support for time-series metrics. Document the business definition alongside the technical definition.
Step 4 — Deploy the USL platform
Deploy your chosen USL platform — either self-hosted like Cube or cloud-managed like AtScale. Connect it to your data warehouse using a service account with read-only access. Configure your pre-aggregations and caching strategy.
Step 5 — Configure access control
Map your organisational roles to USL roles. Define row-level security filters for each role. Set up column-level masking for sensitive fields. Test access control thoroughly before connecting any downstream tools.
Step 6 — Connect downstream tools
Connect each BI tool, notebook environment, and application to the USL using the appropriate protocol — JDBC for Tableau, REST for web apps, GraphQL for custom applications. Deprecate direct warehouse connections for governed metrics.
Step 7 — Version control and CI/CD
Store your semantic model in Git. Set up CI/CD pipelines that run metric validation tests on every pull request — checking that metric definitions return expected values, that joins are correct, and that access control rules apply as intended.
The Role of the Universal Semantic Layer in AI and LLM Architectures
One of the most important emerging use cases for the USL is as a governed data interface for AI agents and large language models.
When an AI chatbot answers a business question like “what was our churn rate last quarter,” it needs access to accurate, contextually correct data. Without a USL, the AI either queries raw tables directly — which requires it to know the schema, joins, and business logic — or it gets pre-computed numbers that may be stale or inconsistently defined.
With a USL, the AI agent queries the metrics API using natural language or structured queries. The USL resolves the metric definition, generates the correct SQL, executes it against the live warehouse, and returns an accurate, governed result. This reduces AI hallucinations on data questions dramatically because the AI is no longer guessing at business logic — it is reading from a defined, tested metric store.
The emerging Model Context Protocol (MCP) standard is being adopted by USL platforms specifically to enable this pattern, allowing AI agents to discover available metrics, understand their definitions, and query them safely within the bounds of the user’s access permissions.
The Bottom Line
The Universal Semantic Layer is not a nice-to-have. In any organization running multiple data tools, multiple teams, and increasingly AI-powered analytics, it is foundational infrastructure.
It solves metric fragmentation at the architectural level. It moves business logic out of individual tools and into a versioned, tested, governed semantic model that serves every consumer in the stack. It enforces security centrally. It makes your data stack AI-ready by design.
The question is not whether your organization needs a Universal Semantic Layer. The question is how much metric chaos you are willing to tolerate before you build one.
Tags: Data Architecture, Semantic Layer, Headless BI, Modern Data Stack, dbt, Snowflake, Data Engineering, SQL, API, AI Data Infrastructure
Leave a Reply